Ways of Showing Waves
Throughout, we will
mainly use three ways of representing the propagation of waves. Examples
are given below that illustrate the different representations.
We have already seen how
waves travel through air by showing the motion of small air 'particles'.
It can be easier to look at the pressure variations that move with the
wave. During compression the particles are closer together, and the
pressure will be higher than normal. During rarefaction they will be
further apart and the pressure will be lower than normal.
Remember the black and red
dots represented in the below animation are not molecules. They are just
markers enabling us to visualize the local displacement of air particles and
so, the rise and fall of pressure within the wave medium. In a typical
sound wave the particles would only move by a very small amount from their
original positions, far too small to be seen. For
the sake of clarity, the particle displacement has been exaggerated a lot.

The 'hot' colours occur wherever particles are close together and the
'cold' colours occur wherever they are far apart. The colours
therefore represent the density of air, which changes as the wave passes
through, or (more usually) the pressure which is proportional to density
for small variations like these. In many pictures from now on we
will just use the colours instead of the dots to show the variations of
density and pressure in a wave. Unless otherwise stated, the scale of
colour is proportional to the variations of density and pressure.

In many (but not all) of
the acoustic waves in nature, the variations in pressure are much smaller than atmospheric pressure.
Rather than talking about 'high' and 'not so high' pressure regions, it is
easier to define acoustic pressure as the difference between the
usual atmospheric pressure and the pressure at a point in the wave.
This acoustic pressure can be positive or negative.
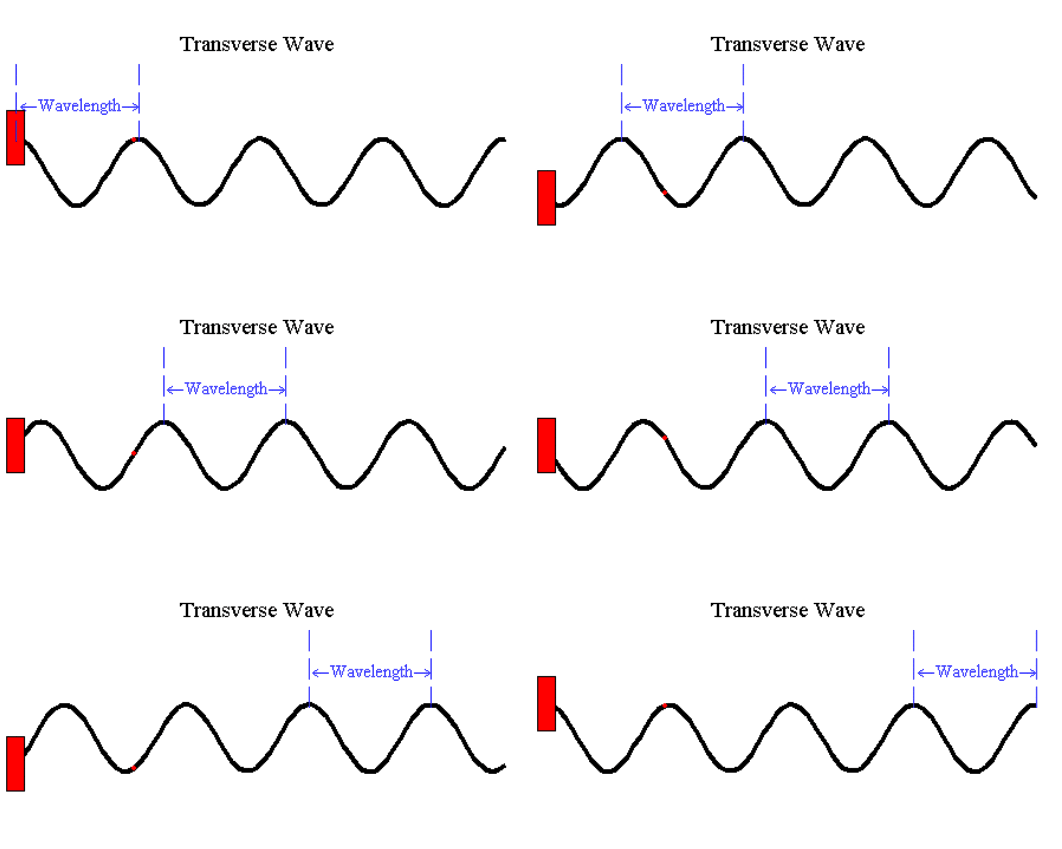
Transverse waves are
readily visualized by means of line graphs. As illustrated by the
animation below, the local oscillations generated at the left end are
always up and down while waves travel from left to right. We can,
however, use a simple line to indicate the pressure in a longitudinal wave
where this is convenient.

|