Acoustical engineers very often have to
analyse sounds by measuring them with a microphone that produces a
fluctuating electrical voltage. Microphones are designed to give a
fluctuating voltage that mimics almost exactly the fluctuating pressure
produced by the sound. We call the microphone output voltage a signal
and the science of analysing these signals is called Signal Processing.
One of the most basic building blocks of
signal processing is the filter which removes some frequencies from a
sound while leaving others unchanged. Here we take a short segment
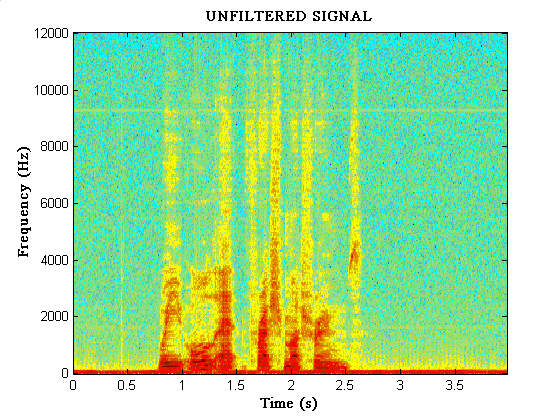
of speech and show the effects of applying different filters. We'll plot
the sound as a function of both time and frequency, so you can see the
effects as well as hearing them. First of all the unfiltered speech.
Click on the graph to hear the sound, and try to relate the picture to
what you are hearing.

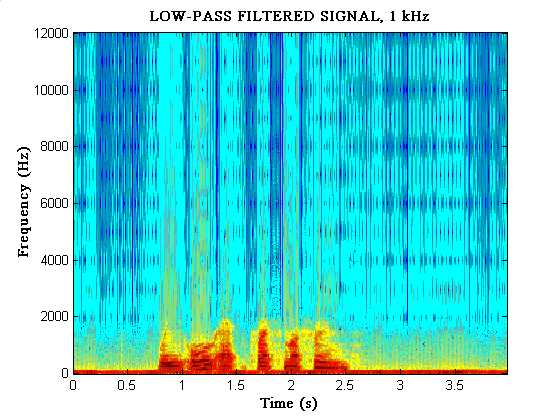
In the next example, you can hear how
the speech sounds when passed through a filter which reduces the amplitude
of everything above 1kHz.

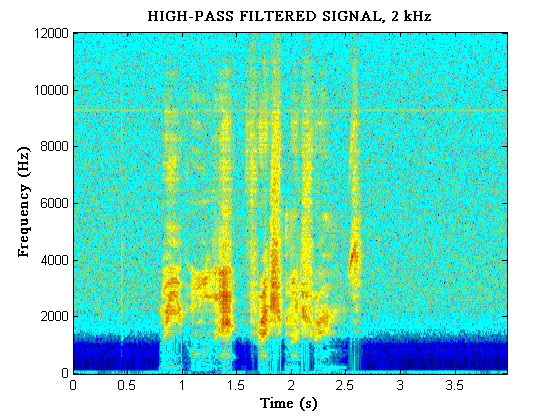
A different effect is obtained by filtering out frequencies
below 2kHz. Compare this to the effect of playing sound over a very
small loudspeaker, such as that found in a miniature radio, which is unable to
reproduce low frequency signals well.

By combining filters we can take out the frequencies in a
particular frequency range. Before listening, ask yourself what
effect you expect this to have on the sound.
